1.1 Hypothesis of the study
The hypothesis is a statement of the unknown population parameter. There are two types of hypotheses in statistics viz. (i) Null hypothesis and (ii) Alternative hypothesis (Wyllys, 2015).
The null hypothesis suggests no statistical significance presence in a set of given observations. It is used to show no variation exists between variables. It is denoted as H0
An alternative hypothesis is a hypothesis that the researcher is trying to prove. It is denoted as H1.
Study Research Question:
1) Is there any significant difference between he life expectancy of a new and old dental impression material?
According to our research question, the null and alternative hypotheses can be formulated in the following manner:
Null hypothesis (H0): There is no statistically significant difference between the life expectancy of a new and old dental impression material.
Alternative hypothesis (H1): There is a statistically significant difference between the life expectancy of a new and old dental impression material.
Unpaired t test or independent sample t test is one of the parametric tests (Statwing, 2016). The parametric test can be used when the population data follow normal distribution / according to the central limit theorem. In general data which have sample size more than 30 approximately follow the normal distribution. Perhaps, if the data failed to follow the normal distribution or it localizes a small number of observations (n<30), the non-parametric tests is the right choice. In this pilot study, the researcher randomly selected some of the observations from the entire population data.
1.1.1 Manual calculation for unpaired sample t test using point estimation
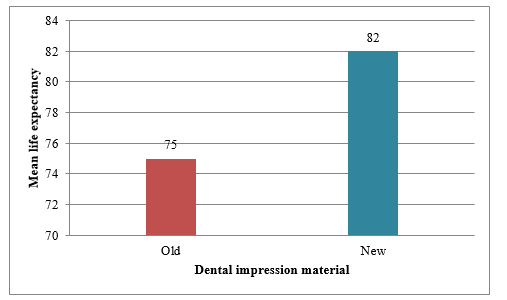
The following Table shows the descriptive statistics. Group A had sample size of 20 while B had 25 with the mean (SD) of 75 hrs (18.7 hrs) and 82 hrs (19.3hrs) respectively.
Table 1: Descriptive statistics of old and new dental impression material
| Old dental impression material (Group A) | New dental impression material (Group B) |
| Sample size (n1) = 15 | Sample size (n2) = 20 |
| Mean (X1) = 75 hrs. | Mean (X2) = 82 hrs. |
| Standard deviation (s1) = 18.7 hrs. | Standard deviation (s2) = 19.3 hrs. |
The formula for independent sample t test to compare two sample means is as follows (Bowles, 2013):
Independent sample t test (
t = 1.0809
Critical value = (Df=n1+n2-2, α=0.05) = (Df=20+25-2, α=0.05)
=(Df=43, α=0.05)
=2.017
The significance value (p) = 0.2270
The computed t value was 1.0809 which did not exceed the critical value 2.017. Hence the the null hypothesis has been accepted. Therefore, it is infered that the two population from which the samples are drawn do have the same mean. Hence, there is no significant difference between the life expectancy of old and new dental impression material.
Figure 1: Bar chart for mean life expectancy of old and new dental impression material
1.2 Calculate a 95% Confidence Interval for the expected difference between the population means
In statistics, there are two different types of estimating techniques: point estimation (PE) and interval estimation (IE). PE offers a single value for the population parameter that is unknown. Maximum likelihood estimation and the technique of moments are two PE procedures (StatTrek, 2016). The population parameter for the IE offers two values, and the CI is one of the interval estimation techniques. The probability that the population parameter will fall between the probability distribution’s top and lower bounds. Any number of probability are possible, although the most frequent ones are often 95% and 99%. (Britannica, 2016).
1.2.1 Manual calculation for unpaired t test using IE:
The CI can be computed by the following formula (Sphweb, 2015):
Confidence Interval (C.I) = (X1 – X2) ± t Sp
Where Sp =
Since, Sample size (n1) = 20; Mean (X1) = 75 hrs.; Standard deviation (s1) = 18.7 hrs.,
Sample size (n2) = 25; Mean (X2) = 82 hrs.; Standard deviation (s2) = 19.3 hrs.,
Sp =
Sp =
Sp =
Sp =
Sp =
Sp = 19.051
Critical value = (Df=n1+n2-2, α=0.05) = (Df=20+25-2, α=0.05)
=(Df=43, α=0.05)
t(43,0.05) =2.017
Confidence Interval (C.I) = (X1 – X2) ± t Sp
Confidence Interval (C.I) = (75-82) ± (2.017) (19.051)
= (-7) ± (2.017) (19.051) (0.3)
= (-7) ± (11.528)
Lower bound = (-7) – (11.528) = -18.528
Upper bound = (-7) + (11.528) = 4.528
Hence the confidence interval is between -18.528 to 4.528. (i.e) (-18.528, 4.528)
1.3 Report the result
1.3.1 Result based on interval estimation
The mean life-expectacy of the old material was 75 hours (SD=18.7 hours) for group A (n=20) while new material did show the mean of 82 (SD=19.3 hours). The actual mean difference between the life expectancy of new and old material impression was -7 hours with the standard error (SE) of the difference as 5.712 hours (Margin error (ME) =11.521 hours) (Explorable, 2015). The SE of difference reveals that around 6 percent (5.712) the sample is an unbiased estimate of the population parameter (McHugh, 2008). The ME (11%) indicates that the sample size is too small for the study. The 95 percent CI for the difference in mean life expectancy impression between new and old material was in the range of -18.528 and 4.528. The difference between the confidence interval of lower and the upper limit is 14.00.
1.3.2 Result based on point estimation
The calculated t (1.0809) is smaller than the critical value 2.017 and significance value (p=0.2270) is greater than 5 percent level of significance (0.05). It leads to accepting the null hypothesis (Refer section 2). These two sections (1 & 2) strongly reveal that there is no sufficient evidence to infer that new material provides a marked improved performance than the old materal. According to the pilot survey, life expectancy of old and new dental impression material performance is similar.
1.4 Inference
The SD of old dental impression material (Group A SD=18.7) as well as new dental impression material (Group B SD=19.3) indicate that there is a huge variation in the life expectancy impression hours within group A and group B. Since, the mean life expectancy hours of old and new dental impression material are 75 and 82 respectively. In addition, the difference between the SD of group A and B is very small (19.3-18.7=0.6). Hence most of the sample observations of group A and B is almost similar data points. It concludes that there is no need to take more samples for additional comparison analysis. Hence, the pilot study is adequate to infer the results.
Section B: The Prevalence of full denture occlusion problems
2.1 Potential Risks and Discomforts
There is no known risk or discomfort anticipated except for the time required for participating in this study.
2.2 Potential Benefits to Participants
By participating, you may be able to receive a summary of the study results. This makes you to aware of full denture occlusion problems which you can correct. These include,
- Better bitting pattern
- Comfort in denture wear
- Comfortable eating
- Ease of speech
- Ease in swallowing
- Improved aesthetics
2.3 Payment for Participants
You will not receive any payment as the study is undertaken for our academic learning purpose.
2.4 Confidentiality
Any information that is obtained in connection with this study and that can be intimated with you will remain confidential and will be disclosed only with your permission or as required by law.
This study is absolutely for educational purpose and it will be erased after the final assessment. We ensure that your personal information will be entertained only for documentation reference.
2.5 Participation and Withdrawal
You can choose whether to be in this study or not. If you volunteer to be in this study, you may withdraw at any time without consequences of any kind.
You may also refuse to answer any questions you don’t want to answer and still remain in the study. The researcher may withdraw you from this research if circumstances arise which in the opinion of the researcher warrant doing so.
2.6 Identification of Investigators
If you have any questions or queries about the research, please feel free to contact me. My name XXXX, Phone no. XXXXX, E-mail. XXXX
2.7 Rights of Research Participants
You may withdraw your consent at any time and discontinue participation without penalty. You are not waiving any legal claims, rights or remedies because of your participation in this research study.
2.8 Target Area
This study is a comparative prevalence and awareness study that will be conducted on 250 white British populations as compared to 250 south Asian populations (India).
2.9 Study Period
The study duration of the present research will be taken from 31st March 2016 to 1st September, 2016, which a period of six months.
2.10 Materials and Methods
The present study will be conducted in the Department of Prosthodontics, xxx. The study design is cross sectional study. The study will employ the use of probing dedntal instruments such as the straight probe, mouth mirror and explorer. Further to this strips of carbon paper will also be used to check for high points on any of the teeth that may hinder occlusion. Additionally, before the start of examination a detailed case history regarding the patients experience with the denture will be ascertained using the questionnaire as detailed below. As for the method, once the patient is comfortably seated in the chair a brief clinical history is taken, which involves details such as age, sex, gender and duration of edentulousness and number of dentures previously/presently in use. Following this, the patient will be administered the questionnaire.
The next procedure will invlove an examination of the occlusion taken both inside the mouth and outside (hand occlusion). With the patient wearing the dentures, the occlusion will be examined both anteriorly as well as laterally. The same will be examined in the handocclusion as well and the differences in occlusion if any will be ascertained.
2.11 Inclusion Criteria (Tripathi, 2013)
- Completely edentulous
- Use of complete dentures
- Adults who were free from any systemic diseases
- Stable ridge pattern
2.12 Exclusion Criteria
- Partially edentulous
- Use of fixed / removable partial dentures
- Temporomandibular joint problem
- Completely resorbed ridge
2.13 Sample Size
As the study is one that is intended to create an awareness on the typrs of dental occlusal problems along with the prevalence measure of these problems between two communities , a representative sample size of 500 will be chosen.
2.14 Questionnaire
In order to assess the patients’ denture occlusion problem, the following questions will be asked to the patients (Komagamine et al., 2014).
2.14.1 Function
Q1. How much pain do you feel?
Q2. How easy is it for you to swallow food boluses and water?
Q3. How well do you enjoy your meals?
Q4. How worn out does your jaw feel?
Q5. How easily are you able to bite?
Q6. Are you able to completely close your mouth?
2.14.2 Aesthetics & speech
Q7. How worried are you about other people watching?
Q8. How easy is it for you to speak?
Q9. How worried are you about your mouth?
Q10. How often do your dentures click when chewing?
2.14.3 Lower denture
Q11. How often does food debris get stuck under your lower denture?
Q12. How is your lower denture retained on the ridge?
Q13. How does your lower denture fit?
Q14. How uncomfortable is your lower denture?
2.14.4 Expectation
Q15. How satisfactory will the new dentures be?
Q16. How problematic will the new dentures be?
Q17. How well will the new dentures fit?
2.14.5 Upper denture
Q18. How often does food debris get stuck under your upper denture?
Q19. How does your upper denture fit
Q20. How often does your upper denture fall down?
2.14.6 Importance
Q21. How much do you consider your dentures as part of your body?
Q22. How important are your dentures to you?
Q23. How much can you care for your dentures without any difficulty?
Q24. How at ease do you feel when wearing your dentures?
References
- Bowles, C. (2013). The P-Value “Formula,” Testing Your Hypothesis. 2013. Trending Sideways.
Explorable (2015). Margin of Error (Statistics). 2015. Explorable. - Investopedia (2016). Null Hypothesis. 2016. Investopedia.
- Komagamine, Y., Kanazawa, M., Kaiba, Y., Sato, Y. & Minakuchi, S. (2014). Reliability and validity of a questionnaire for self-assessment of complete dentures. BMC Oral Health. 14 (1). p.p. 45.
- McHugh, M. (2008). Standard error: meaning and interpretation. Biochemia Medica. 18 (1). p.pp. 7–13.
- Sphweb (2015). Confidence Interval for Two Independent Samples, Continuous Outcome. 2015. Confidence Intervals.
- Statwing (2016). T-Test (Independent Samples). 2016. Statwing.
- Tripathi, G. (2013). Guiding Intellect for Occlusal Errors. JOURNAL OF CLINICAL AND DIAGNOSTIC RESEARCH. 7 (11). p.pp. 2619–2622.
- Wyllys, R.E. (2015). Mathematical Notes for Lis 397.1 Introduction to Research in Library and Information Science. The University of Texas at Austin School of Information.