Examine Indian Railways' service quality problems and their impact on customer satisfaction levels
Tagged: Business & Management
4.1 Introduction
The quantitative study’s findings were presented in this chapter, along with a discussion of the researcher’s stated goal. This chapter details the standard of Indian railway service and how it affects levels of customer satisfaction; as a result, quantitative data were used for this study. The data was collected from passengers of the northern and southern railways using a structured questionnaire. In addition, a total of 120 samples were collected, and the collected data were entered into an excel for further analysis. Using SPSS 25.0, statistical analysis was carried out. A percentage analysis was conducted to determine the respondents’ demographic data, and every component underwent descriptive statistical analysis. Finally, correlation analysis determines the connection between the independent and dependent variables.

4.2 Research context
The questionnaire was developed based on the objective of the study. The sample population was chosen based on the train commuters on the northern and southern lines polled to learn what aspects of service quality they value and how much they influence their satisfaction level. This might help to improve the quality of Indian railway service quality in a better way. The questionnaire contains six following factors. First, the service quality includes five elements: Tangibles, Reliability, Responsiveness, Empathy and Assurance; for measuring the passenger satisfaction level, another aspect of Passenger satisfaction was developed. Second, to create the questionnaire, before it was used to conduct the sample population, emphasis was placed on pilot research to guarantee to construct validity. Third, the pilot study aimed to determine who could provide feedback on their comprehension of the questionnaire. While just a few minor adjustments were needed, the questionnaire was regarded to be understood and, after this clearance had been obtained, was thus conducted online.
4.3 Descriptive statistics
Descriptive statistics were performed for the demographical variables of the respondents who were involved in the research study. The frequency table was performed for the respondent’s demographical variables, the diagrammatic representation was also used, and descriptive statistics were performed for the factors used in the study.
Table 4.1 Frequency table for demographical variables
| Variables | Category | N (%) |
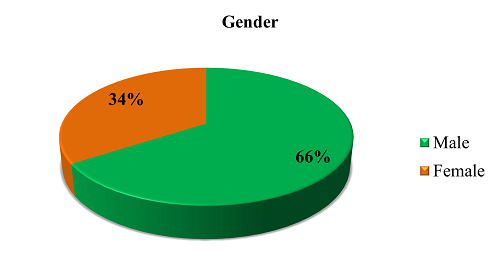
| Gender | Male | 79 (65.8) |
| Female | 41 (34.2) | |
| Age | 20-30 | 45 (37.5) |
| 31-40 | 61 (50.8) | |
| 41-50 | 13 (10.8) | |
| 51 and Above | 1 (0.8) | |
| Educational Qualification | Up to Secondary | 34(28.3) |
| Undergraduate | 62(51.7) | |
| Postgraduate | 24 (20.0) | |
| Occupation | Private sector | 12 (10.0) |
| Business/Industrialist | 81 (67.5) | |
| Government employee | 14 (11.7) | |
| Sales work | 13 (10.8) | |
| Frequency of travel | Daily | 53 (44.2) |
| Weekly | 22 (18.3) | |
| Monthly | 35 (29.2) | |
| Occasionally | 10 (8.3) |
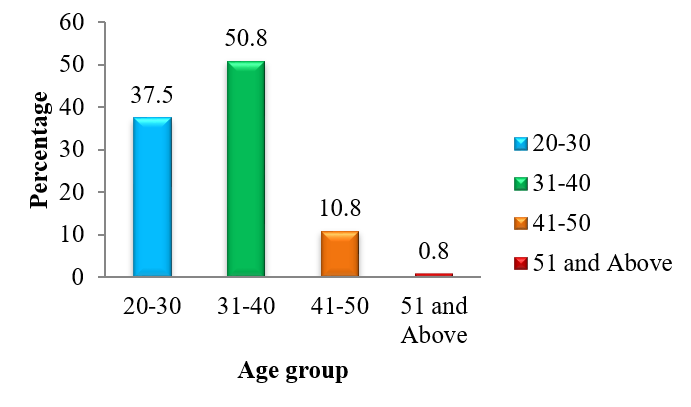
The above table represents the Frequency and percentage of the respondent’s demographical data, whoever was included in this study. The majority of 65.8 % of the respondents were male, and 34.2% of the respondents were female. While considering the age group of the respondents, majorly 50.8% were under the age group of 31-40, followed by 37.5% of the respondents under the age group of 20-30 and 10.8% of the respondents under the age group of 41-50 and only 0.8% of the respondents are under the age group of 51 and above. When considering the educational qualification of the respondent’s majority of 51.7% of the respondents completed their education under graduation, 28.3% of the respondents completed their education at the secondary level, and only 20.0 % of the respondents completed their education post-graduation.
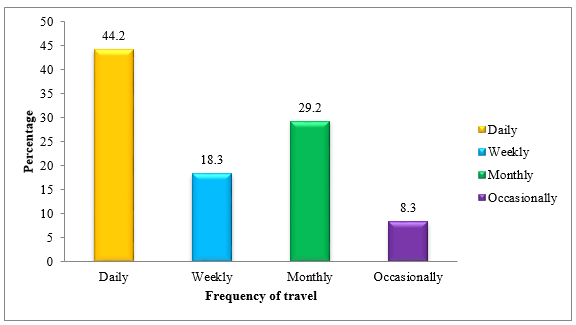
The majority, 67.5% of the respondents, worked in a business and industrialist, 11.7 % of the respondents were government employees, and 10.8 % and 10% of the respondents worked in sales work and the private sector, respectively. Then the Frequency of respondents’ travel was collected based on the fact that the majority of 44.2% of the respondents travelled daily by train, 29.2 % of the respondents travelled monthly, 18.3% of the respondents travelled weekly, and 8.3% of the respondents travelled occasionally.
Figure 4.1 Pie-chart for gender distribution

The above figure 4.1 pie chart describes the gender distribution, where 66% of the respondents were male, and 34% were female.
Figure 4.2 Bar chart for Age group distribution

The above figure 4.2 bar chart represents the age group distribution of the respondents. The highest respondents were in the age group of 31-40, and the lowest respondents were in the group of 51 and above.
Figure 4.3 Bar chart for Frequency of travel

The above figure 4.3 bar chart represents the Frequency of travel of the respondents by train. The highest number of respondents travelled daily, and the lowest travelled occasionally.
Table 4.2 Descriptive statistics for the factors
| Factors | N | Mean | Std. Deviation | Minimum | Maximum |
| Tangibles | 120 | 3.36 | .765 | 2.0 | 5.0 |
| Reliability | 120 | 3.88 | .703 | 3.0 | 5.0 |
| Responsiveness | 120 | 3.38 | .759 | 2.0 | 5.0 |
| Assurance | 120 | 3.73 | .648 | 2.0 | 5.0 |
| Empathy | 120 | 3.52 | .693 | 2.5 | 5.0 |
| Passenger Satisfaction | 120 | 4.46 | .436 | 3.5 | 5.0 |
Table 4.2 represents the mean, standard deviation, maximum and minimum values for the factors used in this study. A total of 120 samples were used for this result. The mean value ranges between 3.36 to 4.46. Passenger satisfaction has the highest mean of 4.46, with an SD of 0.436 with a maximum of 5.0 and minimum of 3.5, followed by Reliability with a mean of 3.88, an SD of 0.703, a maximum of 5.0 and a minimum of 3.0, Assurance with a mean of 3.73 with, SD 0.648 maximum 5.0 and minimum 2.0, empathy with mean 3.52, SD 0.693 maximum 5.00 and minimum 2.5, while Responsiveness with the mean of 3.38 with an SD of 0.759, the maximum value is 5.0 and minimum of 2.0 and finally tangibles with low mean 3.36, SD 0.765 maximum 5.0 and minimum 2.0.
4.4 Reliability analysis
The reliability analysis was performed for the factors used in the study to find the method’s ability to measure something consistently and its ability to ensure that the findings of repeated or equivalent tests will be reliable.
Table 4.3 Reliability analysis for the factors.
| Variables | N of Items | Cronbach’s Alpha |
| Tangibles | 4 | 0.649 |
| Reliability | 4 | 0.783 |
| Responsiveness | 4 | 0.721 |
| Assurance | 4 | 0.724 |
| Empathy | 4 | 0.738 |
| Passenger Satisfaction | 4 | 0.875 |
The above table represents the reliability analysis for the factor used for this study. Then, all the factor scores with an alpha value of more than 0.6 show better Reliability about the elements.
4.5 Correlation
The correlation analysis was performed for the following factors: Reliability, Responsiveness, assurance, empathy and Passenger satisfaction.
Table 4.4 Correlation analysis
| Tangibles | Reliability | Responsiveness | Assurance | Empathy | Passenger Satisfaction | |
| Tangibles | 1 | .305** | .023 | .370** | .155 | .076 |
| Reliability | 1 | -.025 | .306** | .439** | .336** | |
| Responsiveness | 1 | .091 | .572** | .386** | ||
| Assurance | 1 | .216* | -.151 | |||
| Empathy | 1 | .079 | ||||
| Passenger Satisfaction | 1 | |||||
| **. Correlation is significant at the 0.01 level (2-tailed). | ||||||
| *. Correlation is significant at the 0.05 level (2-tailed). | ||||||
The above tables represent the correlation analysis between the factors which explain the relationship between service quality dimensions and passenger satisfaction. The correlation value lies between -1 to +1. Tangibles show a significant positive relationship with Reliability (r=0.305, p<0.01) and Assurance (r=0.370, p<0.01). Reliability shows a positive relationship with Assurance (r=0.306, p<0.01), empathy (r=0.439, p<0.01), satisfaction (r=0.336, p<0.01), Responsiveness shows a significant positive relationship with empathy (r=0.572, p<0.01) and satisfaction (r=0.386, p<0.01). Assurance shows a significant positive relationship with empathy (r=0.216, p<0.05). The correlation value lies between 0.216 to 0.572. The positive correlation value means that when service quality factors increase, satisfaction also increases. Hence there is a positive relationship between service quality factors and the satisfaction level of the customers.
4.6 Regression
The Regression analysis is used to find the relationship between the independent variables and dependent variables.
Hypotheses
- H01: There is no significant impact of tangibles on satisfaction
H11: There is a significant impact of tangibles on satisfaction
Table 4.5: Association between tangibles and satisfaction (n=120)
| Unstandardized
Coefficients |
R Square | t-value | p-value | ||
| Beta | SE | ||||
| (Constant) | 1.902 | 0.235 | 0.506 | 8.079 | 0.000 |
| Tangibles | 0.639 | 0.067 | 9.596 | 0.000** | |
Dependent Variable: Satisfaction, **p<0.01
Table 4.5 represents the impact of tangibles on satisfaction; from table 4.4, reliability (β=0.639, t=9.596, p<0.01) positively influences the passenger’s satisfaction. Hence, tangibles significantly affect the satisfaction with R-square 51% of the variance is explained by Reliability on satisfaction, therefore rejecting the null hypothesis. Hence hypothesis was concluded as,
H11: There is a significant impact of tangibles on satisfaction is accepted.
- H02: There is no significant impact of Reliability on satisfaction
H12: There is a significant impact of Reliability on satisfaction
Table 4.6: Association between Reliability and satisfaction (n=120)
| Unstandardized
Coefficients |
R Square | t-value | p-value | ||
| Beta | SE | ||||
| (Constant) | 5.264 | 0.212 | 0.613 | 24.816 | 0.000 |
| Reliability | 0.208 | 0.054 | 3.870 | 0.000** | |
Dependent Variable: Satisfaction, **p<0.01
Table 4.6 presents the impact of Reliability on satisfaction; from table 4.5, reliability (β=0.208, t=3.870, p<0.01) positively influences the passenger’s satisfaction. Hence, Reliability significantly affects the satisfaction with R-square 61% of the variance is explained by Reliability on satisfaction. Therefore reject the null hypothesis. Hence hypothesis was concluded as,
H12: There is a significant impact of Reliability on satisfaction is accepted.
- H03: There is no significant impact of Responsiveness on satisfaction
H13: There is a significant impact of Responsiveness on satisfaction
Table 4.7: Association between Responsiveness and satisfaction (n=120)
| Unstandardized
Coefficients |
R Square | t-value | p-value | ||
| Beta | SE | ||||
| (Constant) | 5.207 | 0.169 | 0.452 | 30.786 | 0.000 |
| Responsiveness | 0.222 | 0.049 | 4.551 | 0.000** | |
Dependent Variable: Satisfaction, **p<0.01
Table 4.7 presents the impact of Responsiveness on satisfaction; from table 4.6, reliability (β=0.222, t=4.551, p<0.01) positively influences the passenger’s satisfaction. Hence, Responsiveness does have a significant effect on satisfaction with R-square 45% of the variance is explained by Responsiveness on satisfaction, therefore rejecting the null hypothesis. Hence hypothesis was concluded as,
H13: There is a significant impact of Responsiveness on satisfaction is accepted
- H04: There is no significant impact of Assurance on satisfaction
H14: There is a significant impact of Assurance on satisfaction
Table 4.8: Association between Assurance and satisfaction (n=120)
| Unstandardized
Coefficients |
R Square | t-value | p-value | ||
| Beta | SE | ||||
| (Constant) | 4.834 | 0.232 | 0.650 | 20.864 | 0.000 |
| Assurance | 0.102 | 0.061 | 1.656 | 0.001** | |
Dependent Variable: Satisfaction, **p<0.01
Table 4.8 presents the impact of Assurance on satisfaction; from Table 4.7, Assurance (β=0.102, t=1.656, p<0.01) positively influences the passenger’s satisfaction. Hence, Assurance significantly affects the satisfaction with R-square 65% of the variance is explained by Assurance on satisfaction. Therefore reject the null hypothesis. Hence hypothesis was concluded as,
H14: There is a significant impact of Assurance on satisfaction is accepted
- H05: There is no significant impact of empathy on satisfaction
H15: There is a significant impact of empathy on satisfaction
Table 4.9: Association between empathy and satisfaction (n=120)
| Unstandardized
Coefficients |
R Square | t-value | p-value | ||
| Beta | SE | ||||
| (Constant) | 0.961 | 0.211 | 0.718 | 4.546 | 0.000 |
| Responsiveness | 0.839 | 0.055 | 15.135 | 0.000** | |
Dependent Variable: Satisfaction, **p<0.01
Table 4.9 presents the impact of empathy on satisfaction; from table 4.8, empathy (β=0.839, t=15.135, p<0.01) positively influences the passenger’s satisfaction. Hence, empathy significantly affects satisfaction with R-square 71% of the variance is explained by empathy on satisfaction. Therefore reject the null hypothesis. Hence hypothesis was concluded as,
H15: There is a significant impact of empathy on satisfaction is accepted
Table 4.9 Summary of the findings
| Hypothesis | Type of Statistical
test used |
Accept/
Reject |
| H11: There is a significant impact of tangibles on satisfaction | Linear Regression | Accept |
| H12: There is a significant impact of Reliability on satisfaction | Accept | |
| H13: There is a significant impact of Responsiveness on satisfaction | Accept | |
| H14: There is a significant impact of Assurance on satisfaction | Accept | |
| H15: There is a significant impact of empathy on satisfaction | Accept |
4.7 Summary
This chapter demonstrates the acquired data and the researcher’s analysis. People who commute by train on the northern and southern lines are surveyed about the service quality characteristics that influence their satisfaction level and how important they believe they are. The data is presented in a way that makes it easy to interpret using graphs, tables, and descriptive statistics, which makes it possible to conduct correlation and regression analysis on the data. The data for the six variables in this chapter has demonstrated a significant positive association between the degree of passenger satisfaction and the service quality component. The reliability analysis provides reasonable estimates of the factor. The dependent and independent variables were compared using correlation analysis, which revealed that all independent variables positively influenced the dependent variable, albeit to various degrees for each correlation. The hypothesis can be supported for this study because the regression analysis shows that factors affecting service quality have a significant positive impact on satisfaction levels.

