The US and the UK Master’s Part / Chapter-wise Dissertation Writing Service

Then You’ve Certainly Reached the Right place
Managerial Economics Case Study on Johnson and johnson
1. What are the economic conditions in the main markets in which the corporation is operating? In particular,
a. The market structures
The market structures of the pharmaceutical industry are an interesting one. This is because the pharmaceutical market is vastly different from the IT market and the market modelling has been based largely on innovation. There are three aspects of the market structure of the pharmaceutical industry. The first of them being that this industry is strongly reliant on research and development and that which has undergone several radical technological changes. The second factor lies in the aspect that this industry is strongly based on science and science alone. This science base has influenced the course of the industry structure dramatically. More recently, the advent of a new science of molecular biology has had a significant impact on the market structure of the pharmaceutical industry. Thirdly, the pharmaceutical industry since the time it began has been based on the premise of institutional policies, patents and so on. Therefore, the examination of such a dynamic industry makes for an ideal examination of the economics of innovation by way of exploring scientific research in relation to market dynamics and innovation (Malerba & Orsenigo, 2001).
b. Factors affecting supply and demand conditions in the main markets
The main factors that affect the supply and demand conditions in the main markets include policies, productivity cycle, newer patents, reduced profits, early expiration of patented products, and the need for new and innovative products to reach the market. The mainstay issue however has been related to the productivity in the market that is categorised by investment in the research and development sector of the industry and sales which both form the opposing ends of the spectrum that is supply chain. A method with which it was shown to be overcome has been through expansion by way of mergers and acquisitions (M&A). However, a down trend in the productivity has still been consistently recorded. Besides these issues another influential factor on the gap that exists between the research, development and the eventual sales has been due to slower approvals of the FDA. Other factors pertaining to the same are paradigm shifts that have occurred in the regulatory process that now have allowed for fierce competition in the market by allowing for more generics to be sold (reduced patent timelines). A large emphasis has thus been placed on quality rather than quantity that again have immense implications on the current supply chain processes in the pharmaceutical industry presently (Sousa et al., 2011; Snapp & Rangarajan, 2015).
c. Technological factors
The pharmaceutical industry as aforementioned has undergone several technological advancements for better innovation. The technological factors however still hold an immense implication towards the market structure of this industry. There has been a significant advance made in the arena of technology that is fast being imbibed into all streams of business with no exception to the pharmaceuticals. This can be evidenced in the aspect that people nowadays are considering purchasing and research in medications online as opposed to solely relying on the pharmacists for the same. This shift in the trend is one instance that sheds light on the impact of the technological factors. Another instance of the same are the strides as taken in the field of molecular biology through such technological innovation that have not only altered the research and development sector of the industry but has also reshaped the entire market structure as a result making this the most prominent of technological factors affecting the industry presently (Floyd, 2008; Abdullah & Shamsher, 2011).
d. Government regulations
Before delving into the impact of the government regulation on the market structure it is important to understand the market structure as it was. The mainstream aspect in this respect pertains to the high expenditures of public health as perceived by the government. This led to more stringent regulations to lower such costs. This has been proven to be a method through which the costs of drugs have been lowered thereby also lowering the costs for public health. Studies however have demonstrated that these lowered costs are making it harder for the pharmaceutical companies to meet the rising costs for research and development. It has been estimated however that the average cost required to bring a new molecule into the market is around $1 billion. Furthermore, such regulations reduce the incentives for companies to invest in research and develop a new drug which in turn results in incurring large costs over the long term due to the lack of new drugs in the coming years and also the long stages of latency. This hence can have gross impact on the market structure as it stands (Eger & Mahlich, 2014; von der Schulenburg et al., 2011).
e. International dimensions
In the international context of the pharamceutical industry, it has been demmed that a some multinational companies presently form and dominate the market. For the year 2012, majority (66%) of the market was segregated into 20 large dominant pharmaceuticals (Evaluate Pharma, 2013). These countries are seen to be based in major developed countries such as the USA, Japan, or UK. A study in this respect has shown that about 50% of the molecules developed since 1950 have come from 15 of these 20 companies. The projected estimations however predict that the top pharmaceuticals may drop a point by the year 2018 due to the rise in fierce competition from the developing countries into the international market which again goes to alter the market.
f. Future conditions
Companies over the last few years have been consistently releasing new drugs onto the market which has led to the success of big firms in terms of turnover and profitability. The prediction however lies at the reduction in such profits mainly due to the rising costs for investments and low turnovers. Another reason for drying out in the future may be attributed to the expiration of several patents soon, which in turn is slowly giving way to generic drugs thereby largely cutting down the industry’s profits (Karamehic et al., 2013).
g. General macroeconomic factors
The macroeconomic factors of the pharmaceutical industry may be examined by way of examining the research and development, industry structure and the effects of regulation on the costs and prices, the utilisation of drugs and their availability. As for the research and development and the industry structure, biotechnological advances make the economic climate overall more feasible for the market however, the regulations as present in major markets globally may have the converse effect thereby lowering prices and driving costs up. The regulation that leads to an impact on the drug price also has an impact on the availability and the utilisation of the drugs. Furthermore, emerging competition is also a macroeconomic factor that affects the overall economic climate of the industry (Danzon, 2006).
2. How can the corporation organise and invest in its resources (land, labour, capital, managerial skills) in such a way that it can maintain a competitive advantage over other firms in these markets?
a. Cost leader? Pricing strategy?
In terms of the pricing strategy, Johnson and Johnson already have several underway and existent in areas that are most needed. This is evidenced in their pricing programs. The global access and partnerships program (GAPP) is an instance of such pricing strategy where in HIV medication has been made accessible through a not for profit organisation (special effort) in the least developed areas of Africa including the Sub-Saharan region. Others include the supply of QUINVAXEM (a vaccine for five diseases) to the UNICEF and Global Alliance for Vaccines and Immunization with varying pricing strategies in different markets. It can be stated that while their prices are competitive, they are still affordable with initiatives for pricing strategies taken in key and most relevant areas. This is an aspect in which Johnson and Johnson does have a competitive edge over other companies (Johnson & Johnson, 2016).
b. Product differentiation?
Product differentiation is another arena in which Johnson and Johnson already possess a vast competitive advantage over. The most popular in this aspect is the unique Johnson and Johnson baby products. The differentiation is so much so that baby products even to this day is synonymous with Johnson and Johnson. Although there are more products emerging in developing countries, the reputation stands firm which in fact takes on to the following aspect of market niche. This has given the company a competitive advantage that has been unparalleled to date (Johnson & Johnson, 2014).
c. Focus on market niche?
The market niche as mentioned above is already present in the current market scenario with those of the markets for baby products. However, to further maintain an already existent market niche, the company may consider creating other market niches in several different areas. Another market niche that Johnson and Johnson has is in the area of vaccines where, as aforementioned supply vaccines to the UN exclusively (Johnson & Johnson, 2014).
d. Outsourcing, alliances, mergers, acquisitions?
In this regard it has been deemed that Johnson and Johnson of all the top tier pharmaceutical agencies have engaged in the most mergers and acquisitions. This can be mainly attributed to the unique organisation structure of Johnson and Johnson that is decentralised. Further it has been greatly successful in the same and has kept the revenue stable while also addressing the erratic nature of drug discovery. This has Johnson and Johnson at a unique advantage over its competitors (Cohen et al., 2012; Proverbs, 2005).
e. International dimension – regional or country focus or expansion?
While expansion either regionally or with a country focus has been considered an important strategy to maintain competitive advantage. In this aspect an area of expansion that Johnson and Johnson can look into is merging and taking over the market in regions of Asia such as China. More recently the acquisition of a major medical devices industry in China is one such instance. Similarly the market for pharmaceuticals in a country like India is very high and Johnson and Johnson establishing foot hold in such a rising economic can provide a necessary competitive edge (Jordan & Meyers, 2013).
3. What are the risks involved?
a. Changes in demand and supply conditions.
The main risks involved with the change in the demand and supply conditions of the pharmaceutical industries remain ‘blockbuster’ drugs coming off the patent in a few years’ time. Besides these, factors such as the ageing population and chronic diseases also play a relevant role contributing to the risks in the demand and supply. The main risk is however, the lowered focus on the developing countries which have led to an increase in the local companies making such countries emergent markets in the pharmaceutical industry (Deloitte, 2014; Owen, 2011; CBO, 2009).
b. Technological changes and effects of competition.
The risks in terms of the technological changes and the effects of competition revolve around the fact that emerging competition have a lot more to prove in terms of being a serious player in the industry, this will however be evidenced in the form newer innovations at a lower cost than those of the more established in the industry. This can occur when breakthroughs occur in the emerging market which lowers the competitive advantage of the main players and that which may also prompt for private funding to maintain such an edge which in the long term can prove to be an expensive affair (Owen, 2011).
c. Changes in interest rates and inflation rates.
Investor behaviour is one that is consistently changing over time. With this purview it has been found that the pharmaceutical industry is unique. It seems to have a negative relation to inflation that is unanticipated which makes it more susceptible for inflation risk. This can in turn have adverse effects on the interest rates of a company (González et al., 2016).
d. Political risks for companies with foreign operations.
Every country has a varying political system and regulation that have impacts on the various industries. Likewise large organisations also have such large extending influence on the politics of a nation. In this aspect, changes in the political laws and policies pose a significant risk to the corporations. However, keeping in line with the policies while keeping operational costs under control is quite a task taking into consideration the balance needed to be achieved, hence this is a significant risk that can result in the company shutting operations in that particular region.
e. Exchange rate risks.
There are always risks associated with the fluctuating currencies in any economy. This however is more a short term or mid-term risk that can be mitigated.
f. Should we be in this business?
We should most definitely be in this business. As evidenced above, Johnson and Johnson has a massive competitive advantage. Besides this, the following anaysis and figures too depict the financial status of the company in the last three years and denotes that the company has a stellar performance with stable revenue.
Financial Ratios of Johnson & Johnson
Current Ratio
The current ratio is one of the liquidity ratios that assesses the firm’s capability to pay its liabilities by its assets. The firm performance is good in economically if the current ratios are 2 and above. It can be calculated by the following formula (Investopedia, 2016a)
Current Ratio =(Current Assets) / (Current Liabilities)
Table 1: Current ratio of Johnson and Johnson for the year 2013-2015
| 2013 | 2014 | 2015 | |
| Dollars in Millions | |||
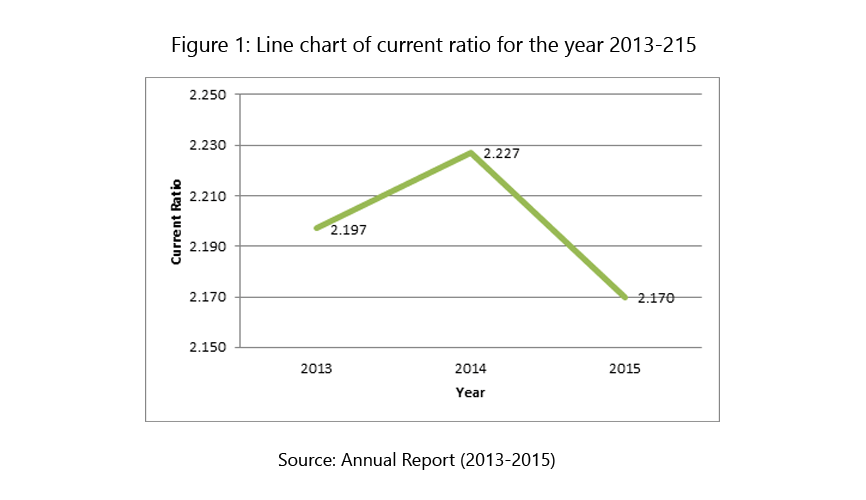
| Current Ratio | 2.197 | 2.227 | 2.170 |
Current ratios of Johnson and Johnson for the year 2013-2015 are depicted in table 1. All the current ratios were more than two which indicate that the performance of Johnson and Johnson was good economically for the year 2013-2015. In addition, current ratio was gradually increased from the year 2013 to 2014. However, a slight drop was occured in the current ratio for the year 2015.
Quick Ratio:
The quick ratio can be used to ascertain the company’s ability to face its short term liabilities. Acid test ratio is another name for the quick ratio (Investopedia, 2016d). The formula for the quick ratio is given below.
Quick Ratio =(Current Assets-Inventories) / (Current Liabilities)
Table 2: Quick ratio of Johnson and Johnson for the year 2013-2015
| 2013 | 2014 | 2015 | |
| Dollars in Millions | |||
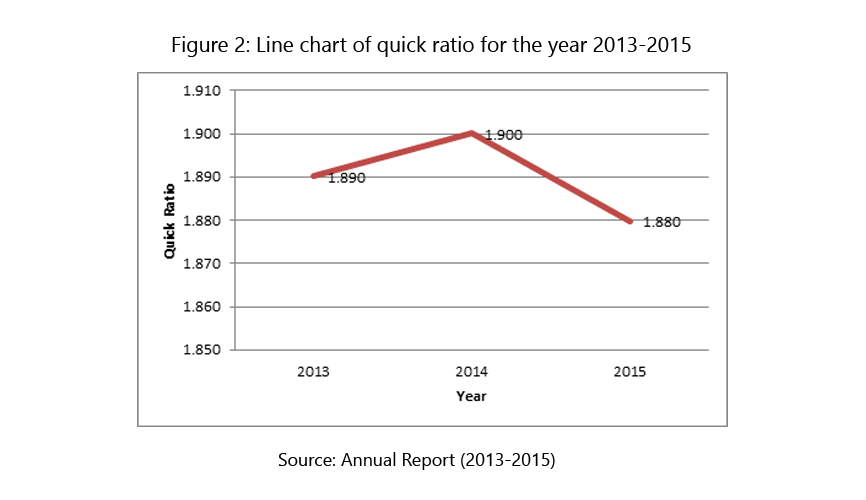
| Quick Ratio | 1.890 | 1.900 | 1.880 |
Table 2 presents the quick ratio of Johnson and Johnson for the year 2013 to 2015. The findings indicate that Johnson and Johnson had $ 1.89, 1.90 and 1.88 million assets to cover each $1 million of liabilities for the year 2013, 2014 and 2015 respectively. The quick ratios also unveil that Johnson and Johnson performed well for the year 2013-2015.
Gross profit margin
Gross profit margin ratio computes the percent of company’s incomes left over after it gives material and labour costs. It can be calculated by the following formula (Investing Answers, 2016):
Gross profit margin =(Gross profit*100) / Sales
Table 3: Gross profit margin of Johnson and Johnson for the year 2013-2015
| 2013 | 2014 | 2015 | |
| Dollars in Millions | |||
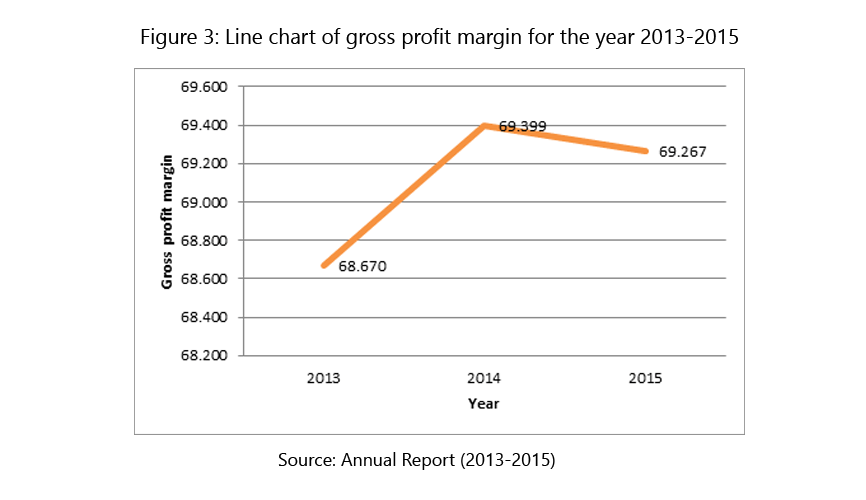
| Gross profit margin | 68.670 | 69.399 | 69.267 |
Gross profit margin ratios of Johnson and Johnson are presented in table 3. The ratios specified that the company had the stability in grass profit margin (around 69%) for the year 2013 to 2015. That is, Johnson and Johnson had 69 percent of incomes left over after it pays material and labour costs for the year 2013-2015.
Interest coverage
Interest coverage ratio is one of the debt and profitability ratios that measures the company’s capability to pay its interest –payment commitment (Investopedia, 2016c). It is a function of earnings before interests and taxes and interest expenses.
Interst Coverage =(Earnings before interests and taxes) / (Interest expenses)
Table 4: Interest coverage of Johnson and Johnson for the year 2013-2015
| 2013 | 2014 | 2015 | |
| Dollars in Millions | |||
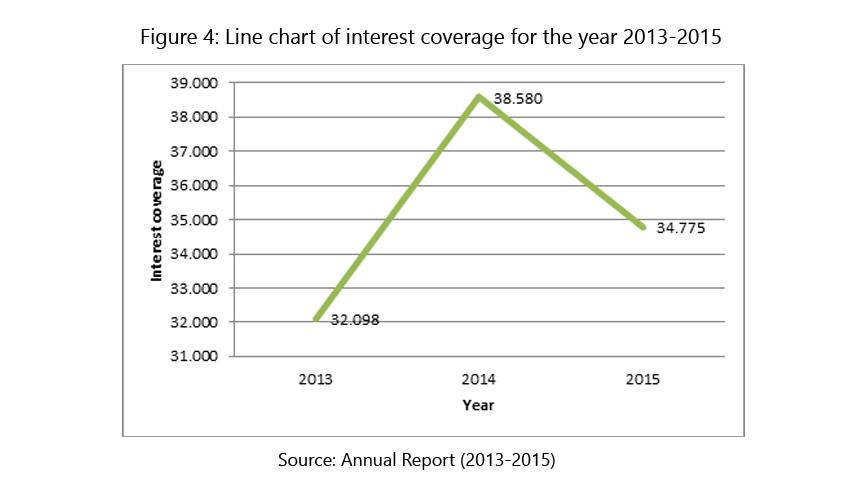
| Interest coverage | 32.097 | 38.579 | 34.775 |
Table 4 shows the interest coverage ratios of Johnson and Johnson for the year 2013-2015. The ratios indicate that the company had 32, 38 and 35 times more earnings compared with their interest payments. It concludes that Johnson and Johnson possessed adequate turnover income to produce their interest expenses for the year 2013-2015. In addition, interest coverage ratio of Johnson and Johnson for the year 2014 was high compared to the year 2013 and 2015.
Debt-Equity Ratio
Debt-equity ratio is one of the liquidity ratios that measures the association between total debt and shareholders’ equity. It is also called as external-internal equity ratio. It is calculated by the following formula (Investopedia, 2016b):
Debt-Equity Ratio =(Total debt) / (Total shareholders' equity)
Table 5: Debt-Equity Ratio of Johnson and Johnson for the year 2013-2015
| 2013 | 2014 | 2015 | |
| Dollars in Millions | |||
| Debt-Equity ratio | 0.246 | 0.270 | 0.280 |
Johnson and Johnson’s debt-equity ratios for the year 2013-2015 is presented in table 5. The findings clearly depict that the ratio values were gradually increased from the year 2013 to 2015. In addition, the ratio values were below 1 which represents Johnson and Johnson possessed more finance from shareholders compared to creditors (bank finance).
Inventory Turnover
Inventory turnover ratio measures how effectively the company’s inventory is sold during the year. The formula for inventory turnover ratio is as follows (CCD Consultants, 2015):
Inventory Turnover =Sales / Inventory
Table 6: Inventory turnover ratio of Johnson and Johnson for the year 2013-2015
| 2013 | 2014 | 2015 | |
| Dollars in Millions | |||
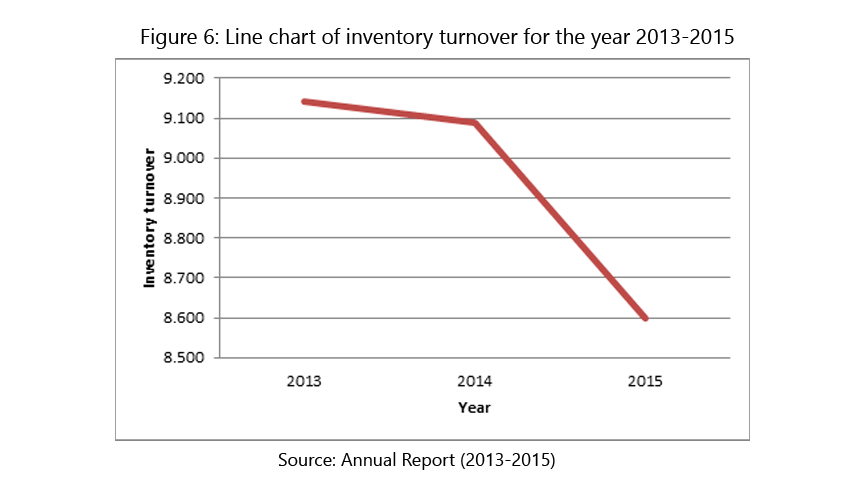
| Inventory turnover | 9.143 | 9.087 | 8.598 |
Table 6 shows the inventory turnover ratio of Johnson and Johnson for the fiscal year 2013-2015. The inventory turnover ratios were declined from the year 2013 to 2015. It indicates that sales were reduced in the year 2015 compared to previous years. Meanwhile, the ratio values were neither high nor low that unveils that Johnson and Johnson’s liquidity was better.

Researchers to mentor-We write your Assignments & Dissertation
With our team of researchers & Statisticians - Tutors India guarantees your grade & acceptance!
About ServicesReferences
Abdullah, M.N. & Shamsher, R. (2011). A Study on the Impact of PEST Analysis on the Pharmaceutical Sector: The Bangladesh Context. Journal of Modern Accounting and Auditing. 7 (12). p.pp. 1446–1456.
CBO (2009). Pharmaceutical R&D and the Evolving Market for Prescription Drugs. In: A series of issue summaries from the Congressional Budget Office. [Online]. 2009, pp. 1–8. Available from: http://www.cbo.gov/sites/default/files/cbofiles/ftpdocs/106xx/doc10681/10-26-drugr&d.pdf.
CCD Consultants (2015). Inventory Turnover Ratio Interpretation. [Online]. 2015. Available from: http://www.ccdconsultants.com/calculators/financial-ratios/inventory-turnover-ratio-calculator-and-interpretation?tab=interpretation. [Accessed: 19 April 2016].
Cohen, J., Gangi, W., Lineen, J. & Manard, A. (2012). Strategic Alternatives in the Pharmaceutical Industry. [Online]. Kellogg School of Management. Available from: https://www.kellogg.northwestern.edu/research/biotech/faculty/articles/strategic_alternatives.pdf.
Danzon, P.M. (2006). Economics of the Pharmaceutical Industry. [Online]. 2006. National Bureau of Economic Research. Available from: http://www.nber.org/reporter/fall06/danzon.html. [Accessed: 19 April 2016].
Deloitte (2014). 2015 Global life sciences outlook Adapting in an era of transformation. [Online]. 2014. Available from: https://www2.deloitte.com/content/dam/Deloitte/global/Documents/Life-Sciences-Health-Care/gx-lshc-2015-life-sciences-report.pdf. [Accessed: 19 April 2016].
Eger, S. & Mahlich, J.C. (2014). Pharmaceutical regulation in Europe and its impact on corporate R&D. Health Economics Review. [Online]. 4 (1). p.p. 23. Available from: http://www.healtheconomicsreview.com/content/4/1/23.
Evaluate Pharma (2013). Outlook to 2018- returning to Growth. World preview 2013. 6th Ed. Evaluate Ltd.
Floyd, D. (2008). The Change Dynamics of the Global pharmaceutical industry. [Online]. 2008. Management Services. Available from: http://www.ims-productivity.com/user/custom/journal/2008/Spring/IMSspr08pg14_18.pdf. [Accessed: 19 April 2016].
González, M. de la O., Jareño, F. & Skinner, F.S. (2016). Interest and Inflation Risk: Investor Behavior. Frontiers in Psychology. [Online]. 18 (7). p.p. 390. Available from: http://journal.frontiersin.org/Article/10.3389/fpsyg.2016.00390/abstract.
Investing Answers (2016). Gross Profit Margin. [Online]. 2016. Available from: http://www.investinganswers.com/financial-dictionary/ratio-analysis/gross-profit-margin-2076. [Accessed: 19 April 2016].
Investopedia (2016a). Current Ratio. [Online]. 2016. Available from: http://www.investopedia.com/terms/c/currentratio.asp. [Accessed: 19 April 2016].
Investopedia (2016b). Debt/Equity Ratio. [Online]. 2016. Available from: http://www.investopedia.com/terms/d/debtequityratio.asp. [Accessed: 19 April 2016].
Investopedia (2016c). Interest Coverage Ratio. [Online]. 2016. Available from: http://www.investopedia.com/terms/i/interestcoverageratio.asp. [Accessed: 19 April 2016].
Investopedia (2016d). Quick Ratio. [Online]. 2016. Available from: http://www.investopedia.com/terms/q/quickratio.asp. [Accessed: 19 April 2016].
Johnson & Johnson (2014). 2014 Citizenship & Sustainability Report. [Online]. 2014. Available from: http://www.jnj.com/sites/default/files/pdf/cs/2014-JNJ-Citizenship-Sustainability-Report.pdf. [Accessed: 19 April 2016].
Johnson & Johnson (2016). Pricing Strategies & Programs. [Online]. 2016. Available from: http://www.jnj.com/caring/citizenship-sustainability/strategic-framework/pricing-strategies-and-programs. [Accessed: 19 April 2016].
Jordan, J. & Meyers, S. (2013). Johnson & Johnson. [Online]. 2013. Available from: http://uoinvestmentgroup.org/wp-content/uploads/2012/09/JNJ-Final.pdf. [Accessed: 19 April 2016].
Karamehic, J., Ridic, O., Ridic, G., Jukic, T., Coric, J., Subasic, D., Panjeta, M., Zunic, L. & Masic, I. (2013). Financial Aspects and the Future of the Pharmaceutical Industry in the United States of America. Materia Socio Medica. [Online]. 25 (4). p.p. 286. Available from: http://www.scopemed.org/?mno=47896.
Malerba, F. & Orsenigo, L. (2001). Innovation and Market Structure in the Dynamics of the Pharmaceutical Industry and Biotechnology: Towards A History Friendly Model. In: DRUID Nelson and Winter Conference. [Online]. 2001, Aalborg, pp. 1–35. Available from: http://www.druid.dk/uploads/tx_picturedb/ds2001-234.pdf.
Owen, M. (2011). Shifting Patterns in the Pharmaceutical Industry. [Online]. 2011. Available from: https://www.chathamhouse.org/sites/files/chathamhouse/1011bp_owen.pdf. [Accessed: 19 April 2016].
Proverbs, P. (2005). Mergers and Acquisitions in the Pharmaceutical Industry. [Online]. 2005. Available from: http://prmrinc.net/wp-content/uploads/2012/08/corporate_strategy.pdf. [Accessed: 19 April 2016].
Von der Schulenburg, F., Vandoros, S. & Kanavos, P. (2011). The effects of drug market regulation on pharmaceutical prices in Europe: overview and evidence from the market of ACE inhibitors. Health Economics Review. [Online]. 1 (1). p.p. 18. Available from: http://www.healtheconomicsreview.com/content/1/1/18.
Snapp, J. & Rangarajan, S. (2015). Supply Chain Analytics: Pharma’s Next Big Bet. [Online]. 2015. Pharmexec. Available from: http://www.pharmexec.com/supply-chain-analytics-pharma-s-next-big-bet. [Accessed: 19 April 2016].
Sousa, R.T., Liu, S., Papageorgiou, L.G. & Shah, N. (2011). Global supply chain planning for pharmaceuticals. Chemical Engineering Research and Design. [Online]. 89 (11). p.pp. 2396–2409. Available from: http://linkinghub.elsevier.com/retrieve/pii/S0263876211001420.
Appendix
Financial ratios calculation
| 2013 | 2014 | 2015 | |
| Dollars in Millions | |||
| Current Assets……..(1) | 56407 | 55744 | 60210 |
| Current Liabilities…….(2) | 25675 | 25031 | 27747 |
| Current Ratio…….(3)= (1)/(2) | 2.196962 | 2.226999 | 2.169964 |
| Current Assets………….(4) | 56407 | 55744 | 60210 |
| Inventories……………….(5) | 7878 | 8184 | 8053 |
| Current Liabilities……..(6) | 25675 | 25031 | 27747 |
| Quick Ratio………………(7)=[(4)-(5)]/(6) | 1.890127 | 1.900044 | 1.879735 |
| Gross profit………………(8) | 48970 | 51585 | 48538 |
| Sales…………………………(9) | 71312 | 74331 | 70074 |
| Gross profit margin……..(10)=[(8)*100]/(9) | 71312 | 74331 | 70074 |
| Earning before interest and taxes……………(11) | 15471 | 20563 | 19196 |
| Interest expenses…………………………(12) | 482 | 533 | 552 |
| Interest coverage…………(13)= (11)/(12) | 32.09751 | 38.57974 | 34.77536 |
| Total debt………(14) | 18200 | 18800 | 19900 |
| Total Shareholders' equity………..(15) | 74053 | 69752 | 71150 |
| Debt-Equity ratio………….(16)=(14)/(15) | 0.24577 | 0.269526 | 0.279691 |
| Sales……………..(17) | 71312 | 74331 | 70074 |
| Inventory………..(18) | 7800 | 8180 | 8150 |
| Inventory turnover………..(19)=(17)/(18) | 9.142564 | 9.086919 | 8.598037 |

Full Fledged Academic Writing & Editing services
Original and high-standard Content
Plagiarism free document
Fully referenced with high quality peer reviewed journals & textbooks
On-time delivery
Unlimited Revisions
On call /in-person brainstorming session
More From TutorsIndia
Coursework Index Dissertation Index Dissertation Proposal Research Methodologies Literature Review Manuscript DevelopmentREQUEST REMOVAL


