Gantt Chart for Dissertation & Research Projects
There are numerous elements involved in managing a dissertation or academic research project.
There are numerous elements involved in managing a dissertation or academic research project. In combination with many tasks, deadlines and dependencies, it can seem quite overwhelming. Fortunately, one of the best tools for making sure you stay organized and on track is to create a Gantt chart. Whether you are undertaking a Master’s dissertation, MBA project, or PhD thesis, a Gantt chart is an excellent visual planning tool to help you plan, manage, and complete your research.
What Is a Gantt Chart?
A Gantt chart is a graphical project management tool that illustrates the schedule of tasks or project phases over time. Gantt charts use horizontal bars to illustrate tasks or activities and provide information about when an activity begins and ends, the duration of each of those tasks, and any relationships that may exist between them. Many academic institutions require a Gantt chart as part of a Research Proposal to demonstrate that the student intends to finish the project on time and has made a logical plan to achieve that.
Why Use a Gantt Chart for Your Dissertation?
By enlisting a Gantt chart to visualize your dissertation, you can organize and clarify the process of completing your dissertation. The checklist helps you:
Many universities in the UK, US, Australia, and other nations now require that Gantt charts be submitted as part of dissertation proposals or ethics submissions.
Key Components of a Dissertation Gantt Chart
An organized Gantt chart for a dissertation usually has the following elements:
1. Research Planning
- Supervisor approval
- Proposal drafting
2. Literature Review
- Gathering sources
- Reading and summarizing
- Writing review chapter
3. Methodology Design
- Choosing research methods
- Drafting methodology chapter
- Preparing research tools (e.g., surveys)
4. Ethical Approval
- Completing ethics form
- Submitting for review
- Awaiting clearance
5. Data Collection
- Conducting surveys or interviews
- Recording observations
- Organizing raw data
6. Data Analysis
- Coding qualitative responses
- Running statistical tests
- Writing the analysis section
7. Writing and Revising
- Drafting findings, discussion, and conclusion
- Incorporating supervisor feedback
- Editing and formatting
8. Final Submission
- Proofreading
- Referencing
- Submission to university
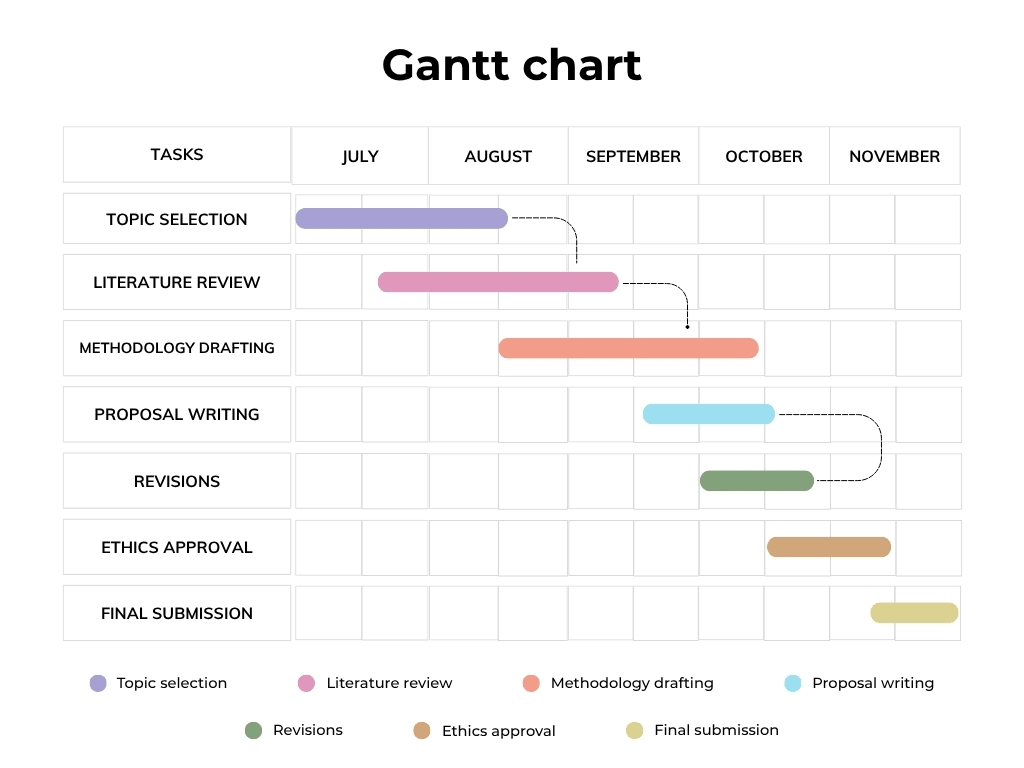
Each of these phases can be plotted on a Gantt chart with specific time frames, making it easy to visualize how long each task will take and when it needs to be completed.
Tools to Create Gantt Charts
You can use a variety of tools to develop a Gantt chart for your dissertation.
Tutors India also write Gantt charts as part of our dissertation proposal and planning work.
Best Practices for Dissertation Gantt Charts
Think about the academic calendar: Holidays, when your supervisor is on leave or does not apply totally flexible in your planning time.
How Tutors India can Help
At Tutors India we deliver customized editable Gantt charts to fit your dissertation plan, university specifications, and schedule. With our service you will receive:
This means not only are you meeting your academic requirements, but also giving your professional project planning tool that you can use with both your supervisor or to put before your ethics committee.
Sample Gantt Chart Structure (Example)
Are You Preparing to Plan Your Dissertation?
Let us handle the heavy lifting involved in your planning! Tutors India have expert research writers and researchers who can create a customized Gantt chart based on your proposal, objectives, and institutional expectations.
Table Of the Content
- Introduction
- What Is a Gantt Chart?
- Why Use a Gantt Chart for Your Dissertation?
- Key Components of a Dissertation Gantt Chart
- Tools to Create Gantt Charts
- Best Practices for Dissertation Gantt Charts
- How Tutors India can Help
- Sample Gantt Chart Structure (Example)
- Are You Preparing to Plan Your Dissertation?
Important Revelations

Selection of a suitable PhD dissertation topic is vitally important for any research study.
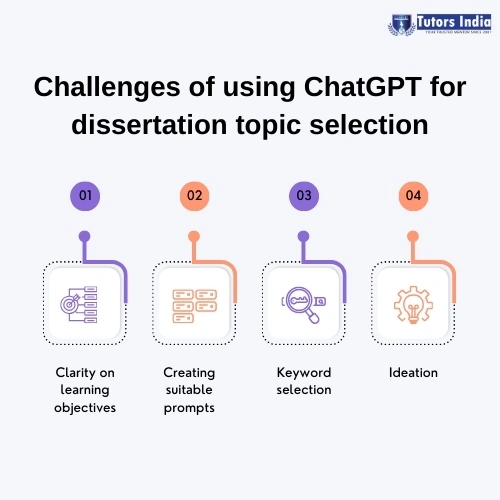
ChatGPT is a natural language processing tool that was created using a Generative Pre-trained Transformer…
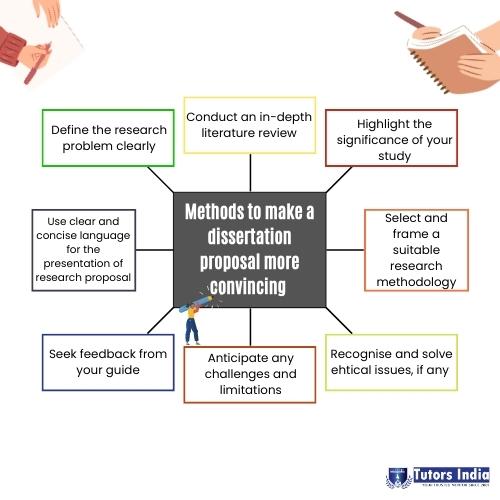
A research proposal could be defined as a written document that describes the intentions of a researcher for conducting a study…