The Various Metrics in Performance analysis
Introduction
Bibliometric analysis is becoming increasingly popular since it explores and analyses a large amount of research data. It enables the researcher to explore how the research on a specific subject has evolved over the years. Bibliometric analysis is used to discover trends in the performance of journals, articles and research. It is a quantitative method that deals with a considerable amount of data, which helps the researcher to advance a field further since it identifies the knowledge gaps and offers an overview of a specific subject. The advent of databases like Scopus and Web of Science and software like VOSviewer, Leximancer and Gephi has led to the method of bibliometric analysis being conducted more practically (Guo,2019).
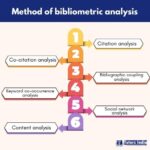
The primary categories of bibliometric analysis techniques are performance analysis and science mapping. Performance analysis is found in most reviews and is the hallmark of bibliometric analysis. It is descriptive and analyses the research contributions to a research field. Various methods of performance analyses are present, the most common being the number of publications and citations yearly or per research constituent (Fernández, 2020).
The metrics for performance analysis
The following are the metrics per the framework for bibliometric analysis as laid by Donthu et al. (Donthu, 2021).
| Metric | Description |
| Total publications (TP) | Total number of publications by the research constituent |
| Publications from academia (TP-A) | Total number of publications by the research constituent from academia |
| Publications from industry (TP-I) | Total number of publications by the research constituent from the industry |
| Publications from academia-industry collaboration (TP-AI) | Total number of publications by the research constituent from academia-industry collaboration |
| Number of contributing authors (NCA) | Total number of authors contributing to the publications of the research constituent |
| Sole-authored publications (SA) | Total number of publications by the research constituent that were sole-authored |
| Co-authored publications (CA) | Total number of publications by the research constituent that were co-authored |
| Number of active years of publication (NAY) | Number of years in which the research constituent has recorded a publication |
| Productivity per active year of publication (PAY) | TP divided by NAY, indicating productivity per active year of publication |
| Total citations (TC) | Total number of citations received by the research constituent |
| Average citations (AC) | The average number of citations per publication, per year, or per period received by the research constituent |
| Collaboration index (CI) | (NCA ÷ TP) ÷ TP, indicating the extent of collaboration of the research constituent |
| Collaboration coefficient (CC) | 1 – (TP ÷ NCA), standardizing the extent of author collaboration between 0 and 1 |
| Number of cited publications (NCP) | Total number of publications by the research constituent that are cited |
| Proportion of cited publications (PCP) | NCP ÷ TP, indicating the proportion of publications by the research constituent that is cited |
| Citations per cited publication (CCP) | TC for NCP, indicating the average number of citations received per cited publication |
| h-index (h) | h number of publications cited at least h times, measuring the influence of the research constituent |
| g-index (g) | g number of publications receiving at least g^2 citations, measuring the impact of the research constituent |
| i-index (i-10, i-100, i-200) | i number of publications cited at least i times (e.g., i = 10, 100, 200, etc.), measuring the influence of the research constituent |
Conclusion
Bibliometric analysis is becoming increasingly popular thanks to the advent of databases and bibliometric software. Performance analysis and science mapping are the two broad categories of techniques for bibliometric analysis. Performance analysis is descriptive and evaluates research contributions to a specific field. The most common performance analysis methods are the number of citations and publications yearly or per research constituent.
Tutors India has offered high-quality services in dissertation and coursework for Masters students. The team consists of UK-based experts who offer assistance at every step, from writing a research proposal, research methodology, and data analysis to publication support. The team ensures the work is plagiarism-free and as per the university guidelines.
References
- Fu Guo, Fengxiang Li, Wei Lv, Li Liu & Vincent G. Duffy (2020) Bibliometric Analysis of Affective Computing Researches during 1999~2018, International Journal of Human–Computer Interaction,36:9, 801-814, DOI:10.1080/10117318.2019.1688985 2
- Fernández-González, J. M., Díaz-López, C., Martín-Pascual, J., & Zamorano, M. (2020). Recycling Organic Fraction of Municipal Solid Waste: Systematic Literature Review and Bibliometric Analysis of Research Trends. Sustainability, 12(11), 4798. MDPI AG. Retrieved from http://dx.doi.org/10.3390/su12114798
- Naveen Donthu, Satish Kumar, Debmalya Mukherjee, Nitesh Pandey, Weng Marc Lim, How to conduct a bibliometric analysis: An overview and guidelines, Journal of Business Research, Volume 133, 2021, Pages 285-296, ISSN 0148-2963, https://doi.org/10.1016/j.jbusres.2021.04.070.

 Previous Post
 Next Post