
Computer Science & IT
Coding & Algorithms Development
Computer Science & IT
Shrewd Object Visualization Mechanism
AI For Cybersecurity and Knowledge Breach
Machine Learning in Hyperautomation
The Intersection of ML and IoT
Consistent Integration with Other Languages
Shrewd Object Visualization Mechanism
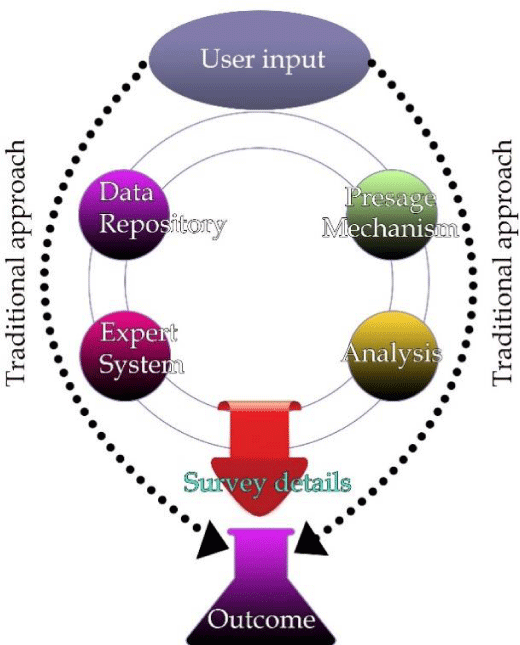
There has been a massive increase in the creation of data across an extensive range of fields. The quantitative content of a data and human experience is bridged by visualization. Visualization objects encompass data that is deliberated to produce visualization. Human brain is capacitated to conduct scalable visual findings in data-based researches. The exact outcome of diverse visualization mechanism is measured by adopting a shrewd strategy.
Data visualization talks about those techniques that are used to communicate information or data by encoding it as visual objects through lines, points, or bars that are found in graphics. There are five ways by which the Big Data Visualization is categorized.
Temporal- They are one-dimensional and linear. They either overlap or stand alone with a start time and finish time. Polar area diagrams and Time series sequences are examples of temporal visualization.
Hierarchical-It is meant for that order groups within bigger groups. Examples include Tree diagrams.
Network- In this a set of data connect deeply with another and show how they are related to one another. Examples of network data visualizations include Matrix charts.
Multidimensional data visualization- These types of visualizations are vibrant and eye-catching.
Geospatial- It is also known as spatial data visualizations and relates to real life physical location. These types of data visualizations are commonly used in multinational corporations.
Therefore, shrewd object visualization helps in understanding data effectively and Data becomes meaningful by visualization.

Source: peertechzpublications.com
References
Ashraf, S. (2020). Towards Shrewd Object Visualization Mechanism. Trends in Computer Science and Information Technology, 5(1), 097-102.
Ashraf, S., Saleem, S., Ahmed, T., Aslam, Z., & Muhammad, D. (2020). Conversion of adverse data corpus to shrewd output using sampling metrics. Visual Computing for Industry, Biomedicine, and Art, 3(1), 1-13.